
Expertise / 03
Dashboards & decision support
Make the right information impossible to miss.
Make the right information impossible to miss.
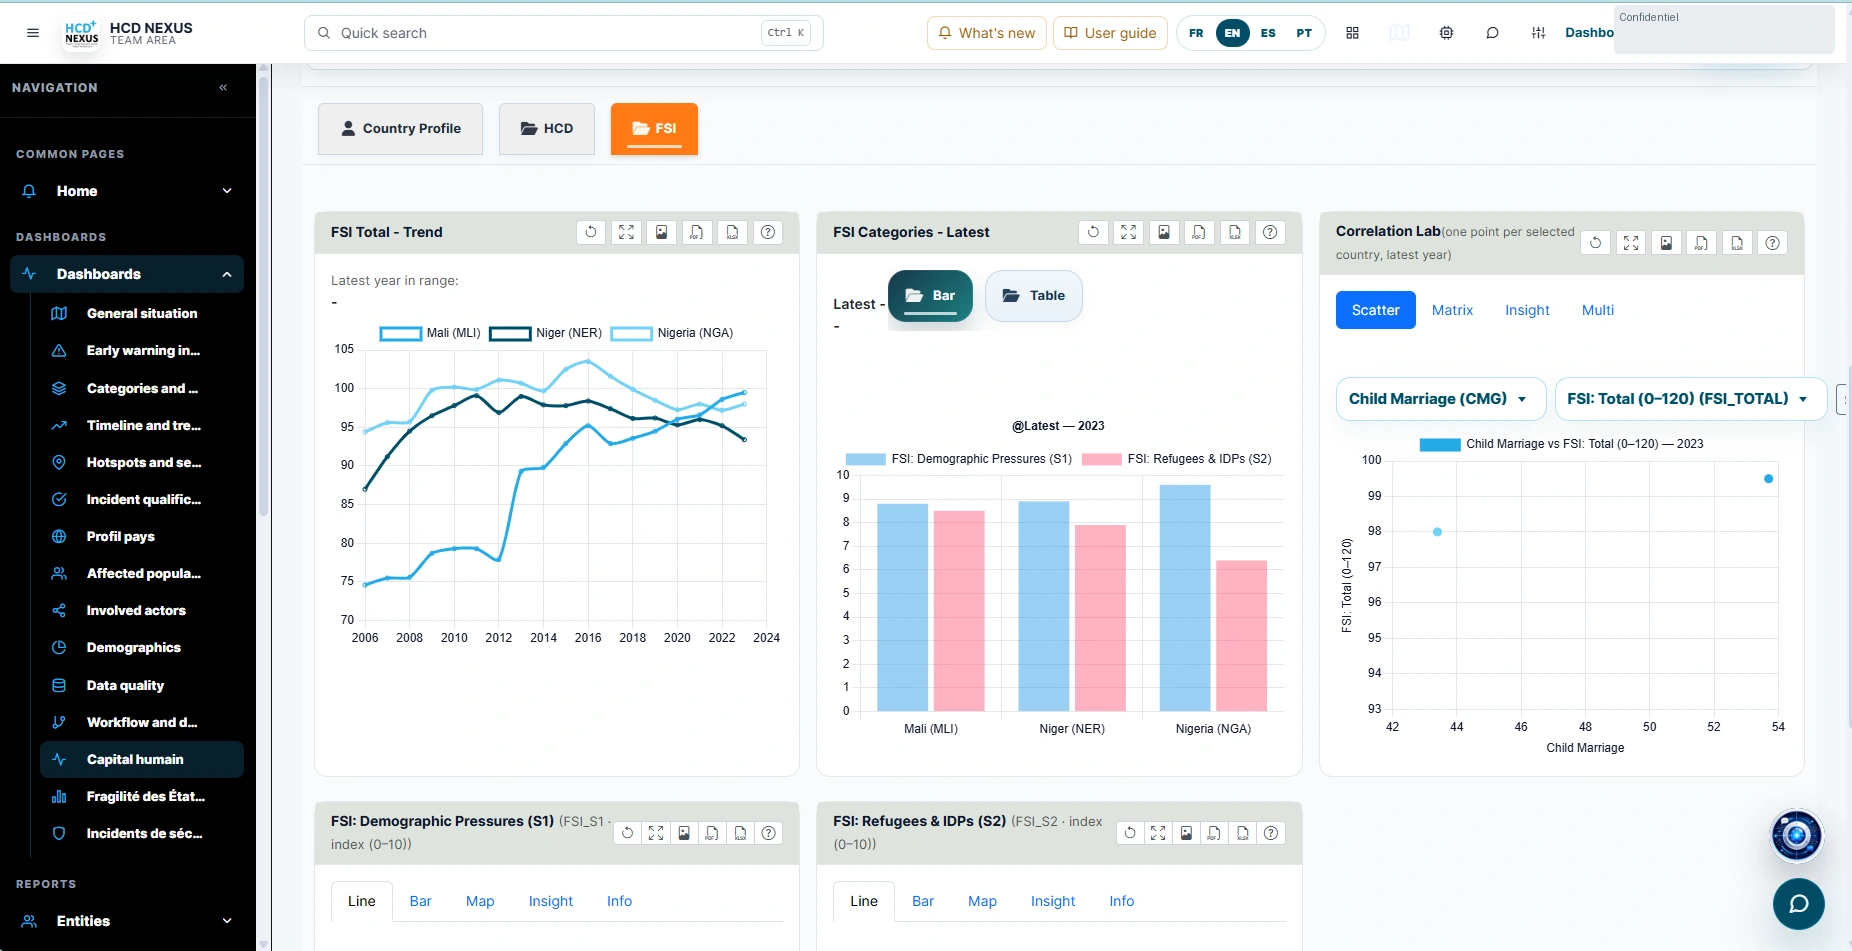
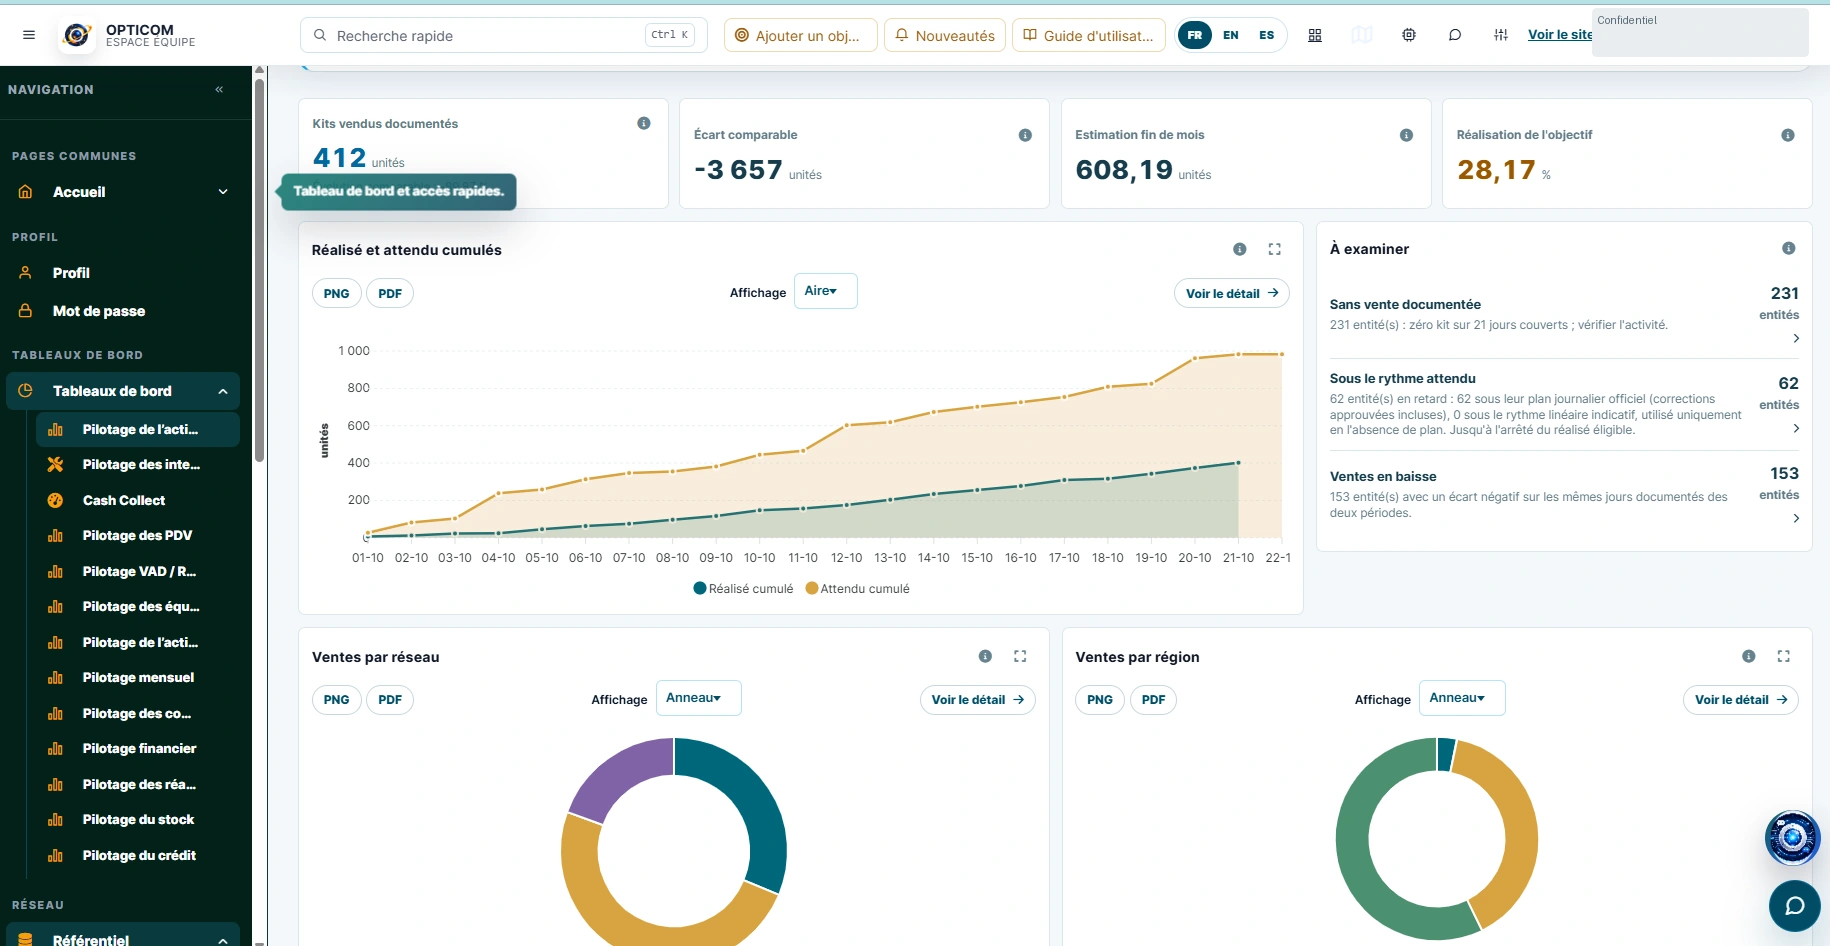
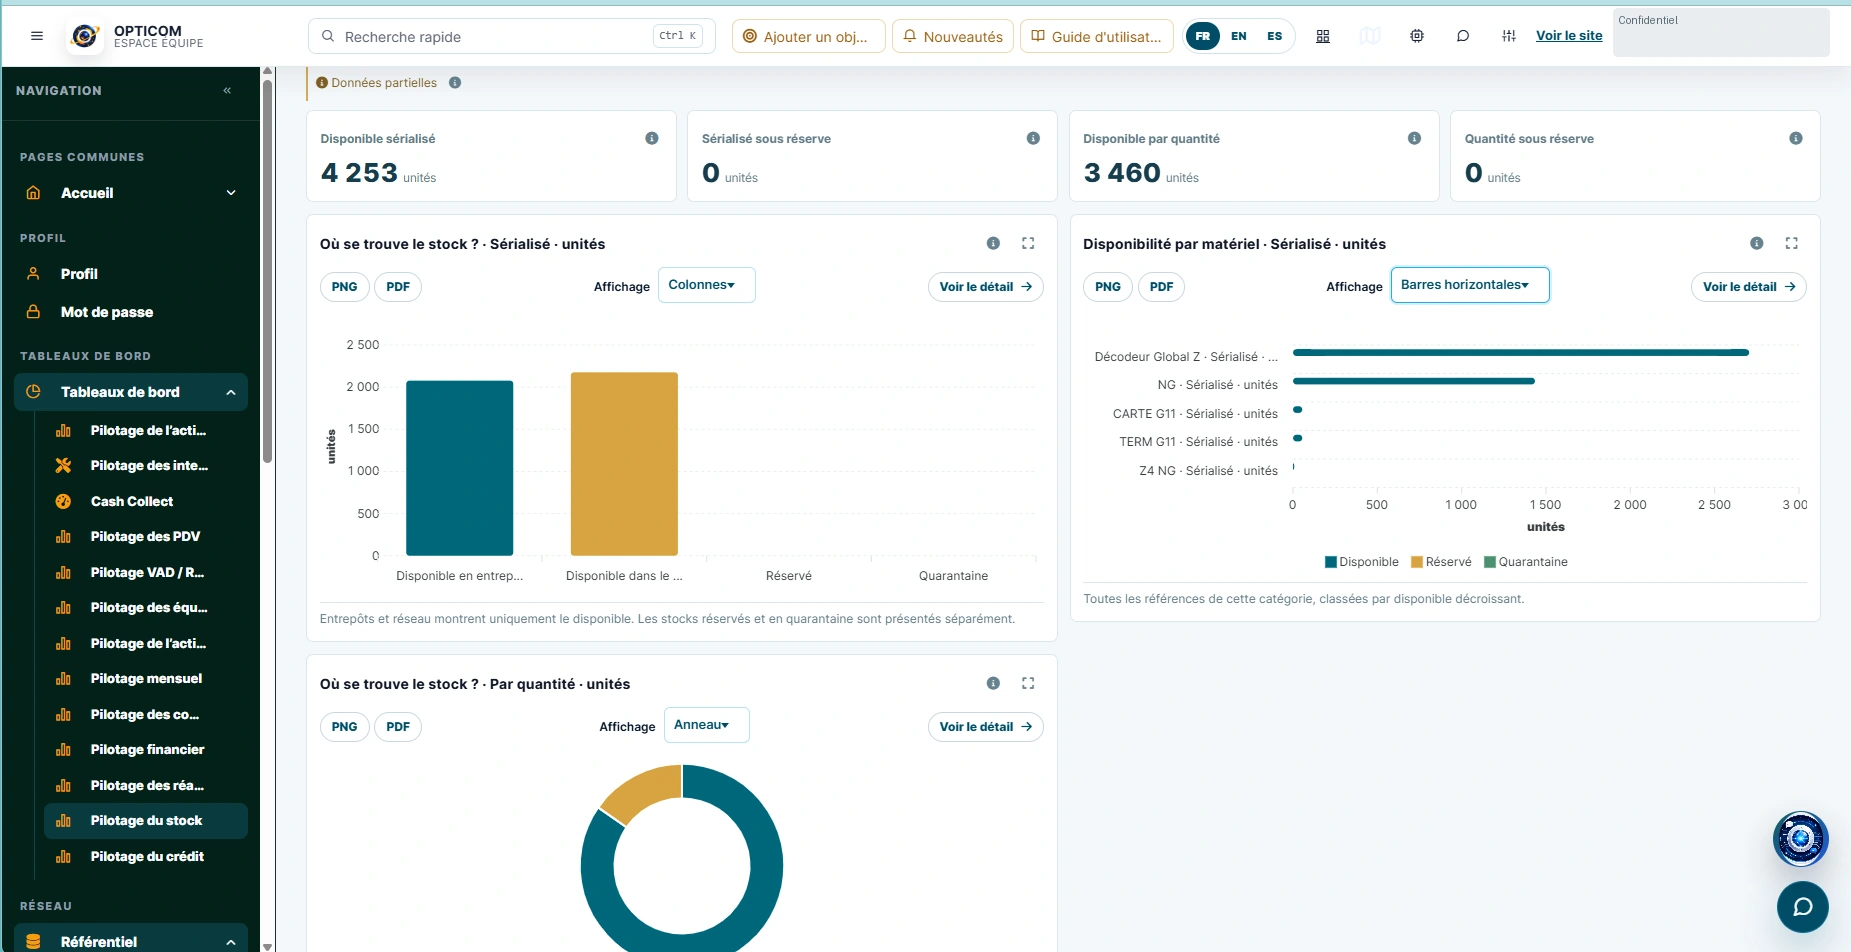
Give analysts and decision-makers a shared view. Move between indicators, maps, time periods and the underlying evidence.
We start with the questions your teams need to answer, then organise the metrics and drill-down paths that help them understand changes and set priorities.
Discuss this capabilityWhat we build
- 01
Interactive dashboards & scorecards
Combine key figures, trends and status summaries in views suited to different responsibilities.
- 02
Configurable indicators & scoring workflows
Define formulas, baselines and thresholds clearly so scores can be understood and reviewed.
- 03
Geographic filters & comparative analysis
Compare territories, periods and groups while keeping the selected scope visible.
- 04
Reports, workbooks & controlled exports
Prepare shareable outputs that retain the filters and definitions behind the analysis.
Where it makes a difference
Management intelligence, monitoring and evaluation, and institutional decision support. For example, follow programme delivery, review financial performance or identify territories requiring closer attention.
LET’S BUILD SOMETHING THAT MATTERS
Bring us your
next challenge.
A new platform. A complex integration. A better way to see your data. Let’s start with the problem you want to solve.